
Buying a vacation property is one of the biggest financial decisions you’ll make. Understanding vacation property prices in your target market separates smart buyers from those who overpay.
We at Up North Property Management help investors navigate this process every day. This guide walks you through the research steps that matter most before you make an offer.
How to Research Vacation Property Prices Before Buying
Comparable Sales Data Forms Your Foundation
Comparable sales data is your foundation for understanding whether a property is overpriced or underpriced. You need to gather recent sales transactions for similar vacation properties in your target area-focus on homes that match your property type, size, and location within the last 6 to 12 months. Real estate websites, county assessor records, and local MLS data provide this information, though working with a local real estate agent often gives you faster access to actual closed deals rather than asking prices. The median home price tells you the baseline, but the price per square foot matters more. Properties with rental history sold differently than those without.
A beachfront home in Dauphin Island, Alabama sold for a median of $645,330 according to Vacasa’s Vacation Rental Report, while North Myrtle Beach properties median around $360,747-nearly $300,000 lower. This gap reflects supply constraints in popular coastal markets and shapes your ROI expectations. You should look at the last 3 to 5 years of sales data to spot whether prices are rising steadily, plateauing, or declining. Track whether homes sell above or below asking price, which signals demand strength.
Seasonal Patterns Drive Your Revenue Model
Seasonal pricing patterns in vacation rentals don’t follow traditional real estate sales cycles. Properties in Girdwood, Alaska see 61% of bookings concentrated in 2 to 3 night stays, driven by winter resort demand, while Hatteras Island in North Carolina shows more than half of bookings lasting seven nights or longer. These patterns mean your property’s revenue potential depends on guest stay length and peak seasons specific to your location.
You should compare nightly rates across Airbnb, Booking.com, and Vrbo for similar properties during peak season versus off-season months. Tools like comparable sales data and PriceLabs’ Revenue Estimator Pro let you input a specific address and property features to see annual revenue, average daily rate, occupancy rates, and which months drive income.
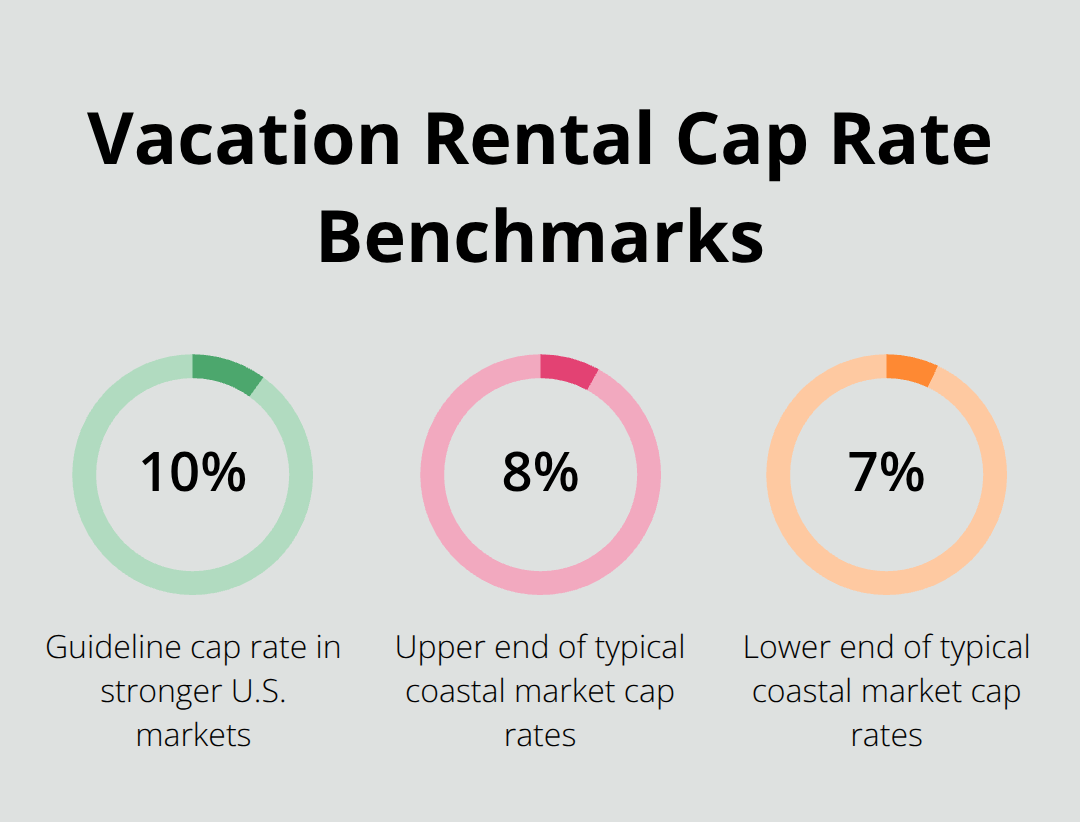
Cap Rates and Income Projections Matter More Than Purchase Price Alone
This data reveals whether a property can support its purchase price through rental income. A cap rate of around 10% serves as a guideline in stronger markets, but coastal properties often deliver 7 to 8% cap rates. Okaloosa Island, Florida averaged $50,000 in annual rental revenue with a 7.7% gross cap rate, while Hatteras Island reached $58,862 annually at 7.3%. Your purchase price must align with these realistic income projections, not wishful thinking about perfect occupancy.
The next step involves examining the specific location factors that influence both your purchase price and your ability to attract guests year-round.
What Income Should You Actually Expect
Compare Properties That Match Your Target
Nightly rates vary wildly across vacation rental markets, and the rates you see listed on Airbnb or Vrbo today won’t match what you’ll earn next year. Start by comparing properties identical to what you plan to buy-same number of bedrooms, similar amenities, and in the exact neighborhood you’re targeting. Tools like PriceLabs’ Revenue Estimator Pro and AirDNA MarketMinder let you enter a specific address and property features to pull actual revenue data rather than guessing. Okaloosa Island properties pull in over $50,000 annually according to Vacasa’s Vacation Rental Report, but that’s an average hiding significant variation. A beachfront condo commands different nightly rates than a cottage two blocks inland.
Track Seasonal Rate Swings Separately
Seasonal pricing patterns shift dramatically throughout the year. Track rates across peak, shoulder, and off-season months separately-Okaloosa Island sees seasonal pricing swings of 5 to 10%, meaning your winter rate might be double your summer rate or vice versa depending on local tourism patterns. This variation matters because it shapes your cash flow timing. A property that generates strong winter income might sit nearly empty in summer, forcing you to maintain the property year-round while collecting minimal revenue during slow months.
Occupancy Rates Determine Real Income
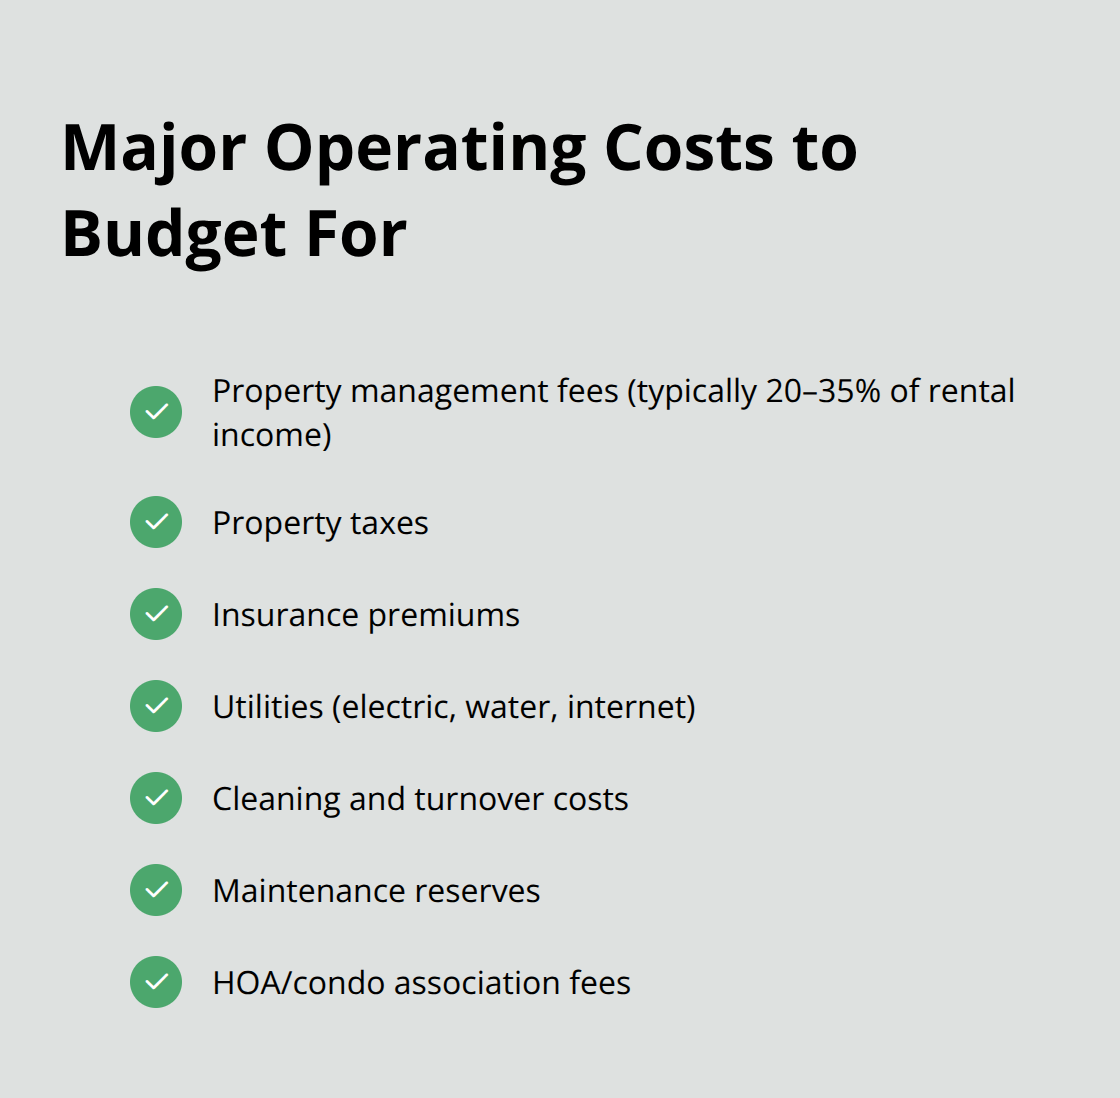
Occupancy rates determine whether those nightly rates translate into actual income. A property with a $200 nightly rate sounds great until you realize it sits empty 40% of the year. Research occupancy percentages in your target market using AirDNA’s data or by contacting local property managers willing to share realistic numbers. Once you know average occupancy and nightly rates, calculate your projected annual gross revenue, then subtract management fees (typically 20 to 35% of rental income if you hire a manager), property taxes, insurance, utilities, cleaning costs, maintenance reserves, and HOA fees if applicable.
Operating Costs Erode Profitability
This math reveals your actual cash position. A property generating $50,000 gross revenue might net only $15,000 after expenses, which changes whether a $600,000 purchase price makes financial sense. Too many buyers focus only on the top-line revenue number and ignore operating costs that erode profitability. The cap rate calculation-annual net operating income divided by purchase price-shows real returns. Vacation properties in strong leisure markets may offer cap rates from 6% to 10%, but your net cap rate after all expenses might be 3 to 4%. That’s the number that matters for your investment decision.
Location-Specific Factors Shape Your Revenue Reality
Beyond the numbers, your location determines whether guests book your property consistently or leave it vacant during shoulder seasons. The next section examines how proximity to attractions, local tourism patterns, and accessibility influence both your purchase price and your ability to maintain strong occupancy year-round.
Location Decides Everything
Tourism patterns in your target market determine whether a property generates income consistently or sits vacant during weak seasons. Okaloosa Island, Florida attracts about 5 million visitors annually, with most stays running four nights or longer, creating sustained demand across the year. Contrast this with Girdwood, Alaska, where 61% of bookings last only 2 to 3 nights near Alyeska Resort, concentrating income into winter months.
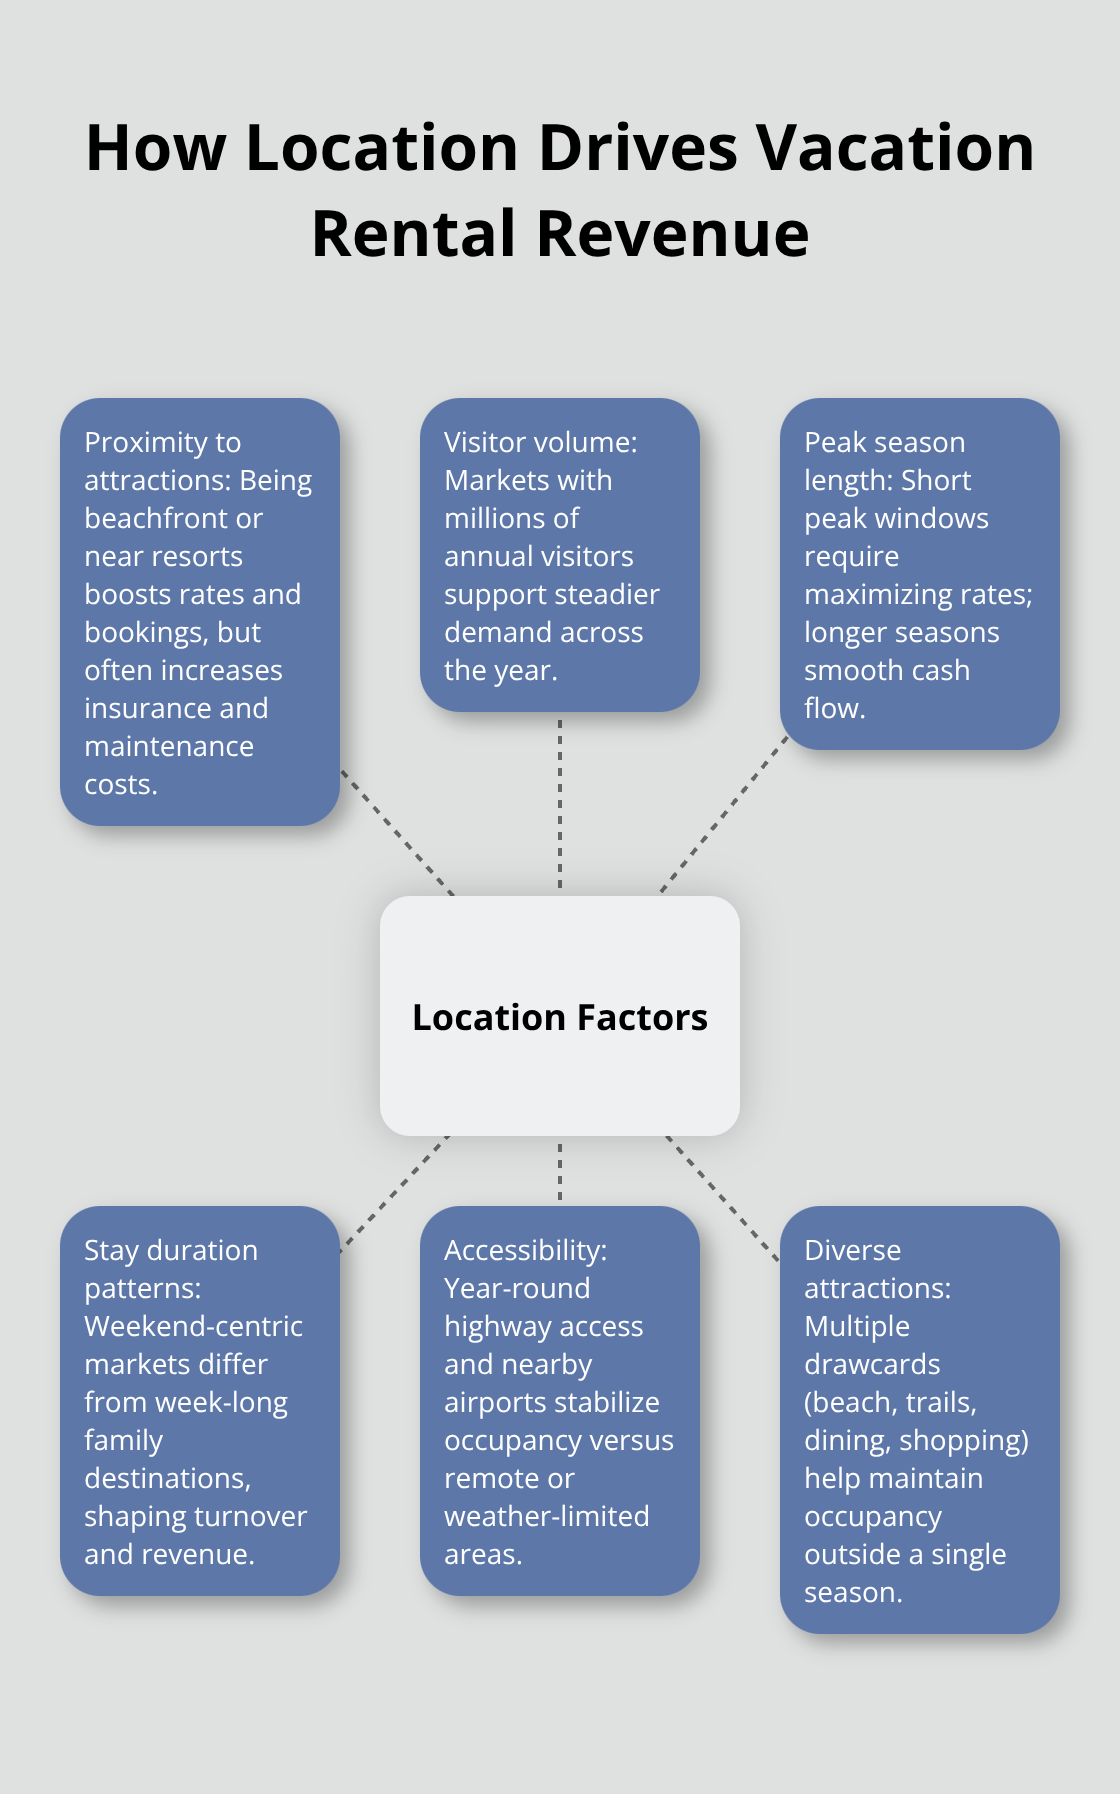
Before you buy, research your specific location’s visitor volume, peak season length, and whether tourists stay for weekends or extended vacations. Contact the local tourism bureau or chamber of commerce for visitor statistics from the past three years. This data reveals whether your property will generate steady year-round income or depend on a narrow seasonal window where you must maximize rates to cover annual expenses.
Proximity to Attractions Commands Higher Rates
Properties near major attractions command higher nightly rates and attract more bookings, but this advantage comes with trade-offs. A beachfront home in Dauphin Island, Alabama generates average annual rental revenue of $53,293 compared to inland properties that earn significantly less. However, beachfront properties require higher maintenance due to salt exposure, insurance premiums cost more, and guest turnover happens faster with shorter average stays. Properties two blocks from the beach or near resort amenities still capture substantial demand without the premium costs. Research what specific attractions drive bookings in your market. If your target area depends on a single ski resort, convention center, or seasonal festival, occupancy will fluctuate dramatically outside those windows. Markets with diverse attractions (beaches, hiking, dining, shopping) maintain more stable occupancy throughout the year. Walk the neighborhood and note what guests actually mention in reviews on Airbnb and Vrbo for comparable properties. Mentions of proximity to specific restaurants, trails, or activities reveal what genuinely attracts bookings versus marketing hype.
Transportation Access Shapes Operating Costs and Revenue Timing
Accessibility matters more than distance. A property 30 minutes from an airport with direct flights maintains higher occupancy than one requiring connections through hub cities. Seasonal accessibility changes affect revenue timing significantly. Hatteras Island, North Carolina shows more than half of bookings lasting seven nights or longer, but winter weather makes the property harder to reach and maintain. Girdwood, Alaska sees winter demand surge near the ski resort while summer accessibility improves but demand drops. Research whether your target location experiences weather-related closures, road maintenance periods, or seasonal transportation changes. This directly impacts your ability to service the property and guests’ willingness to book. Properties with year-round highway access and nearby regional airports maintain steadier occupancy. Calculate your annual maintenance and emergency service costs based on location accessibility, then adjust your cap rate expectations accordingly. Remote or seasonally isolated properties require higher nightly rates to justify the operational complexity.
Final Thoughts
You’ve now walked through the research process that separates informed buyers from those who overpay for vacation properties. Start with comparable sales data to establish what similar properties actually sold for, then layer in seasonal pricing patterns and occupancy rates specific to your location, and finally stress-test those numbers against realistic operating costs. This approach reveals whether vacation property prices in your target market align with the income your property can generate.
The biggest mistake investors make is falling in love with a property’s location or aesthetics, then working backward to justify the purchase price. Instead, let the numbers lead-if a property’s cap rate falls below 6% after accounting for all expenses, the purchase price is too high relative to income potential, regardless of how beautiful the beachfront view is. Compare your target property against at least three comparable sales in the same neighborhood, verify occupancy rates through local property managers or AirDNA data, and calculate your net operating income honestly (a property generating $50,000 gross revenue but only $15,000 net income after expenses tells a different story than the headline number suggests).
Before making an offer, contact local property management companies to understand typical operating costs in your market. They can provide realistic occupancy percentages, seasonal rate variations, and maintenance expenses based on actual properties they manage. If you’re considering Northern Minnesota properties, Up North Property Management handles the full management process, from marketing and bookings to cleaning and maintenance, which removes guesswork about operational feasibility.